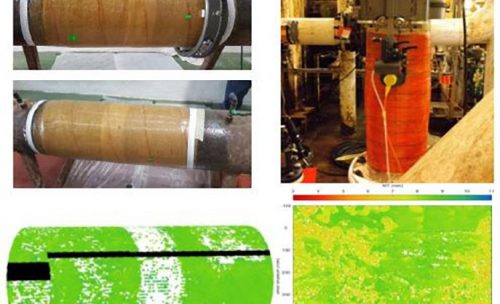
We’ve been busy learning about the full range of specialised and proprietary inspection services offered by Sonomatic our sister company. We wanted to share a technology developed by Sonomatic’s in house R&D team called Dynamic Response Spectroscopy (DRS) which recently won the Petronas Technology challenge for inspection through composite overwrap repairs over carbon steel pipelines and piping
DRS corrosion mapping utilises low frequency ultrasound (<1 MHz) to penetrate coatings and excite the natural frequencies of vibration of the underlying steel. A custom DRS probe, held above the pipe surface, emits a broad range of low ultrasonic frequencies. The lower attenuation at these frequencies allows the ultrasound to pass more easily through challenging coatings. The steel responds to the input signal, vibrating at frequencies related to its thickness. These vibrations pass out through the coating and are received by the DRS probe as it scans across the pipe surface. The frequency content of the received signals is then extracted, using advanced signal processing algorithms developed by Sonomatic, and used to determine the thickness profile of the steel.
Where flaws such as delamination’s are present in composite repairs, transmission of the DRS signals is blocked by the air trapped inside. DRS maps these flaws where the steel response signal is lost. However, DRS does not distinguish between interlaminar flaws and those at the steel interface which are a more serious threat to the integrity of the repair.
To find out more contact Alex Cesan the General manager for Australia and check out the data sheets http://www.sonomatic.com/advanced-inspection/applications/pipelines/inspection-through-coatings
Email: Alex.Cesan@sonomatic.com
Tel: :+61 8 6240 2450


